HTML Subpages
Overview
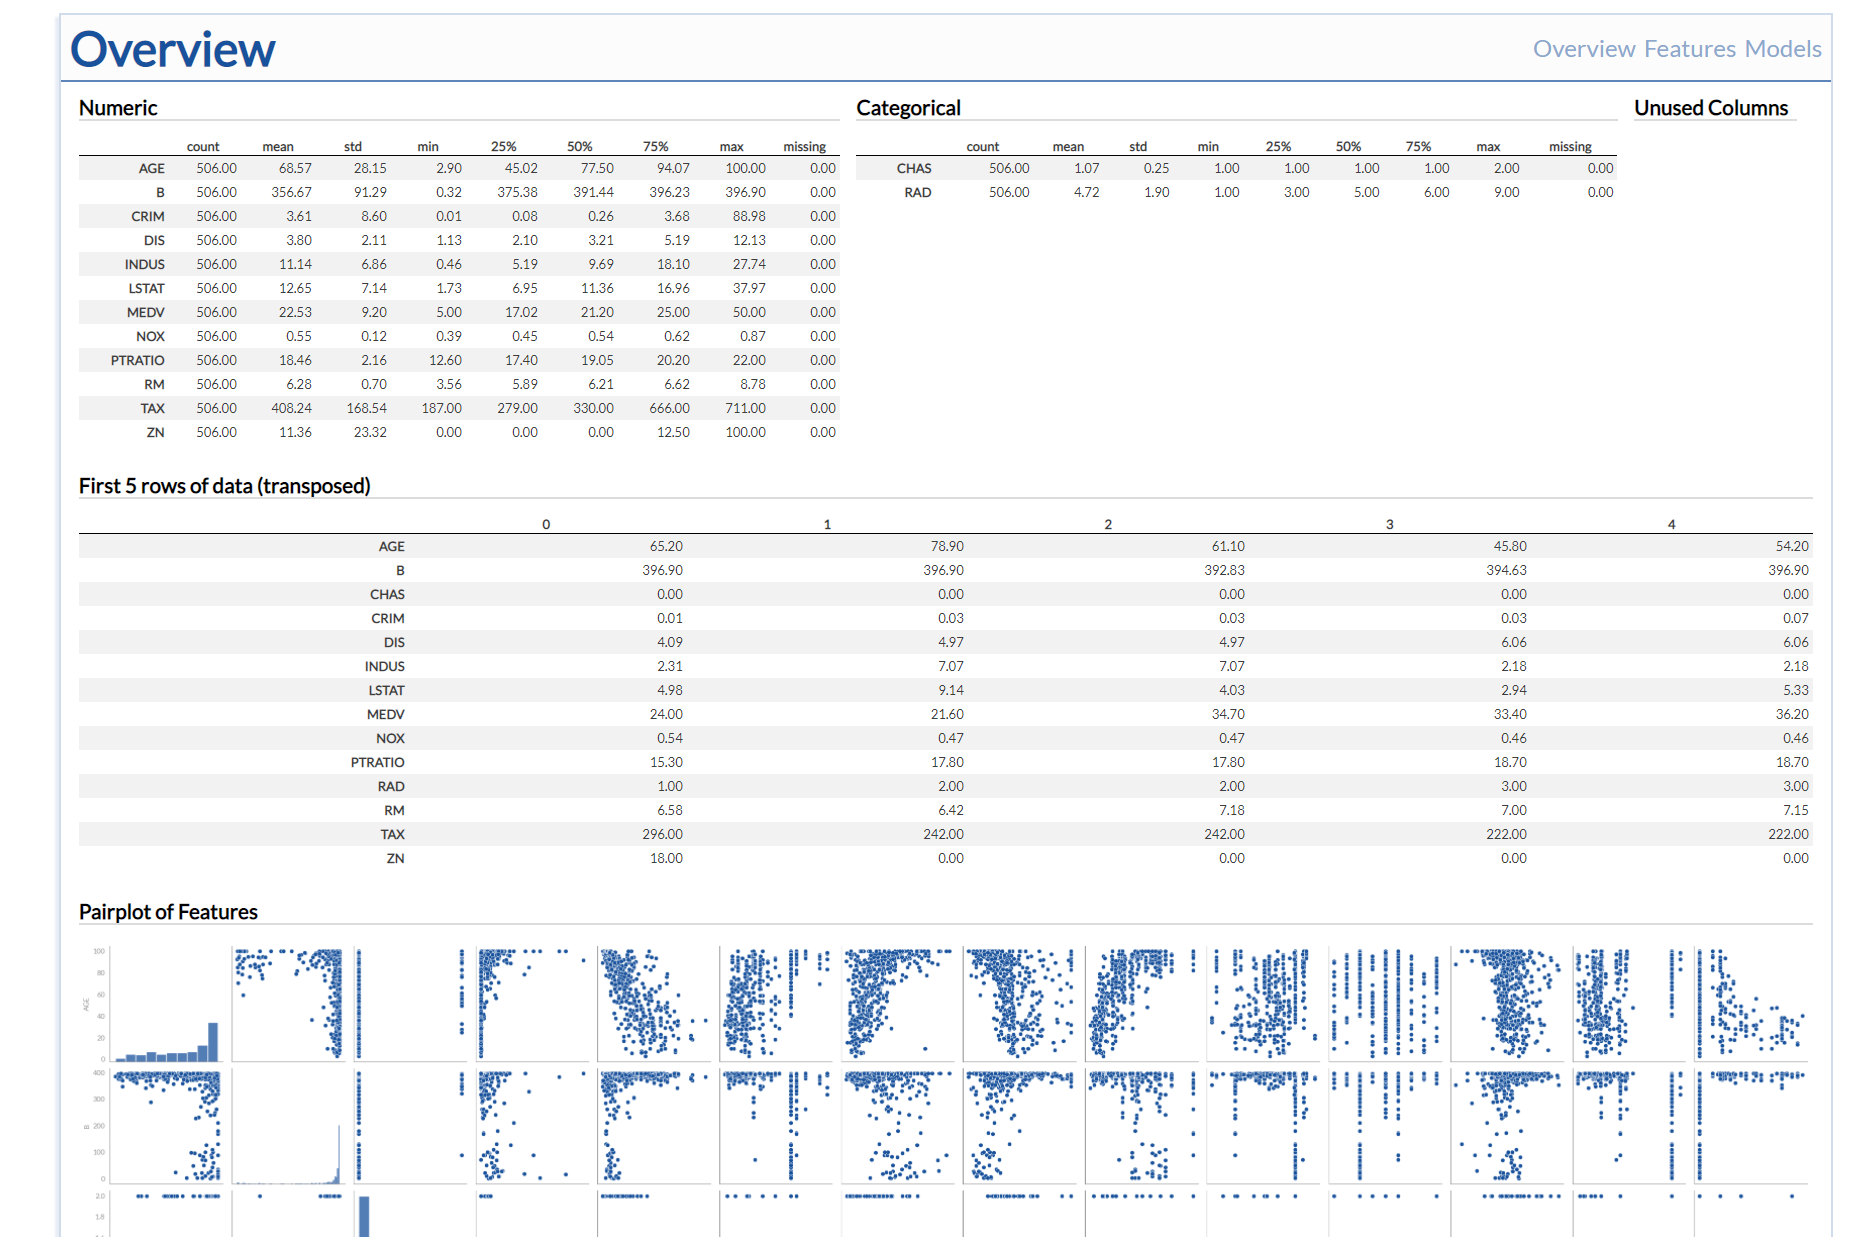
Overview subpage gives general information on the Features - their summary statistics, number of missing values,
etc. (similar to describe method from pandas.DataFrame).
If the number of features isn’t too big, seaborn pairplot is also included.
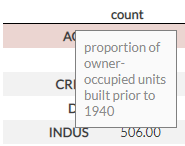
Note
Feature names in all tables are ‘hoverable’ - upon hovering, corresponding description and mapping will be shown.
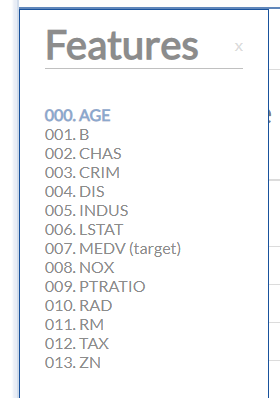
Features View
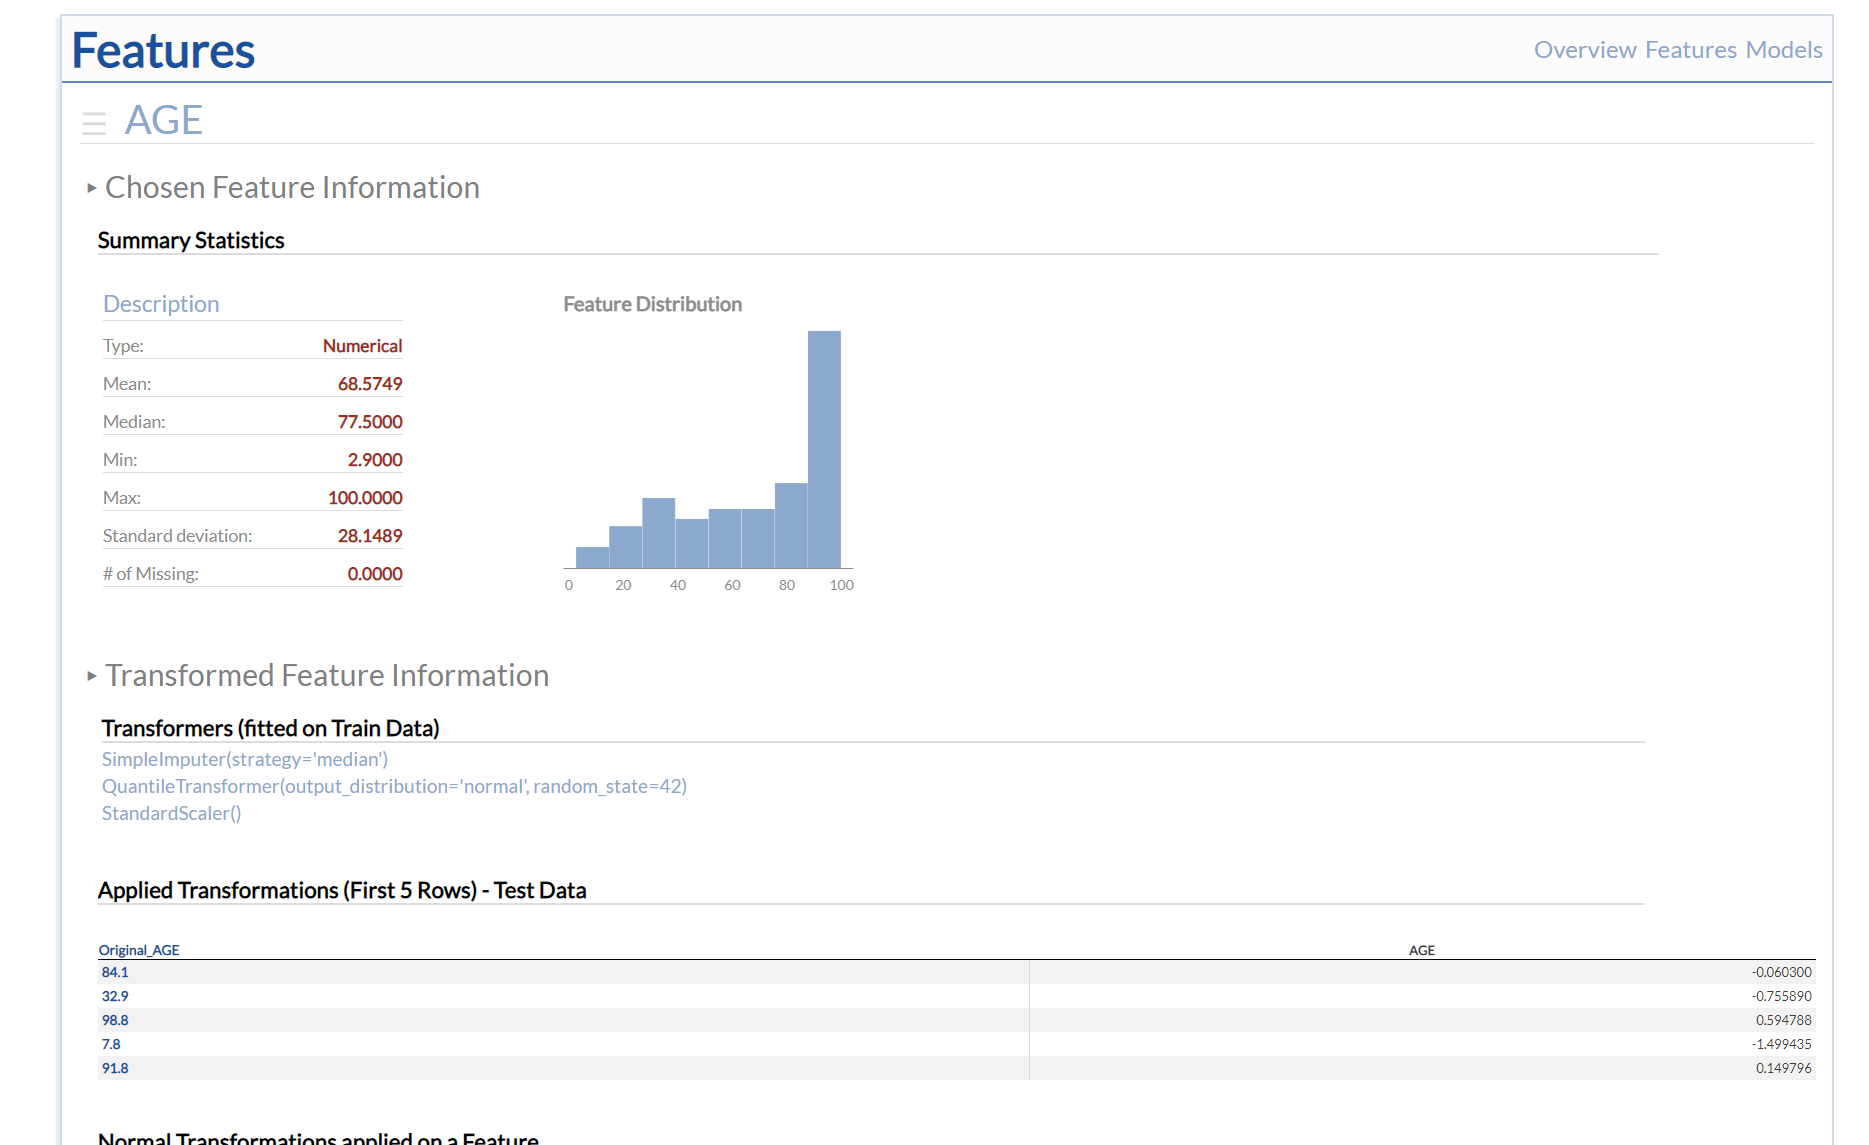
Features subpage allows you to dive deeper into each Feature present in your data. Not only summary
statistics and underlying distribution are included, but also transformations and correlations with other features
- feature engineering might be a little bit easier. To change displayed feature, you can click on the ‘burger’
button in the upper left corner and choose another one from the opened menu.
Note
Depending on the number of features, refreshing the page upon feature selection change might take a while - please be patient!
Content in Features subpage is divided into subsections that you can easily expand or hide (if the page gets
too cluttered). First two sections provide information on a chosen feature (both original and transformed), whereas the
third section shows correlations between all features (normalized and original), regardless of selection.
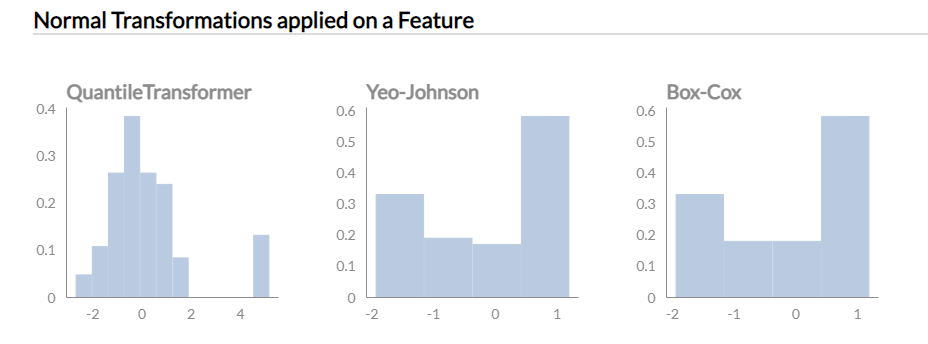
Note
When Numerical Feature is selected, Transformations sections will show plots of Normal Transformations. This should help you make a conscious decision which of the Transformers is the best for that feature (per sklearn guidance).
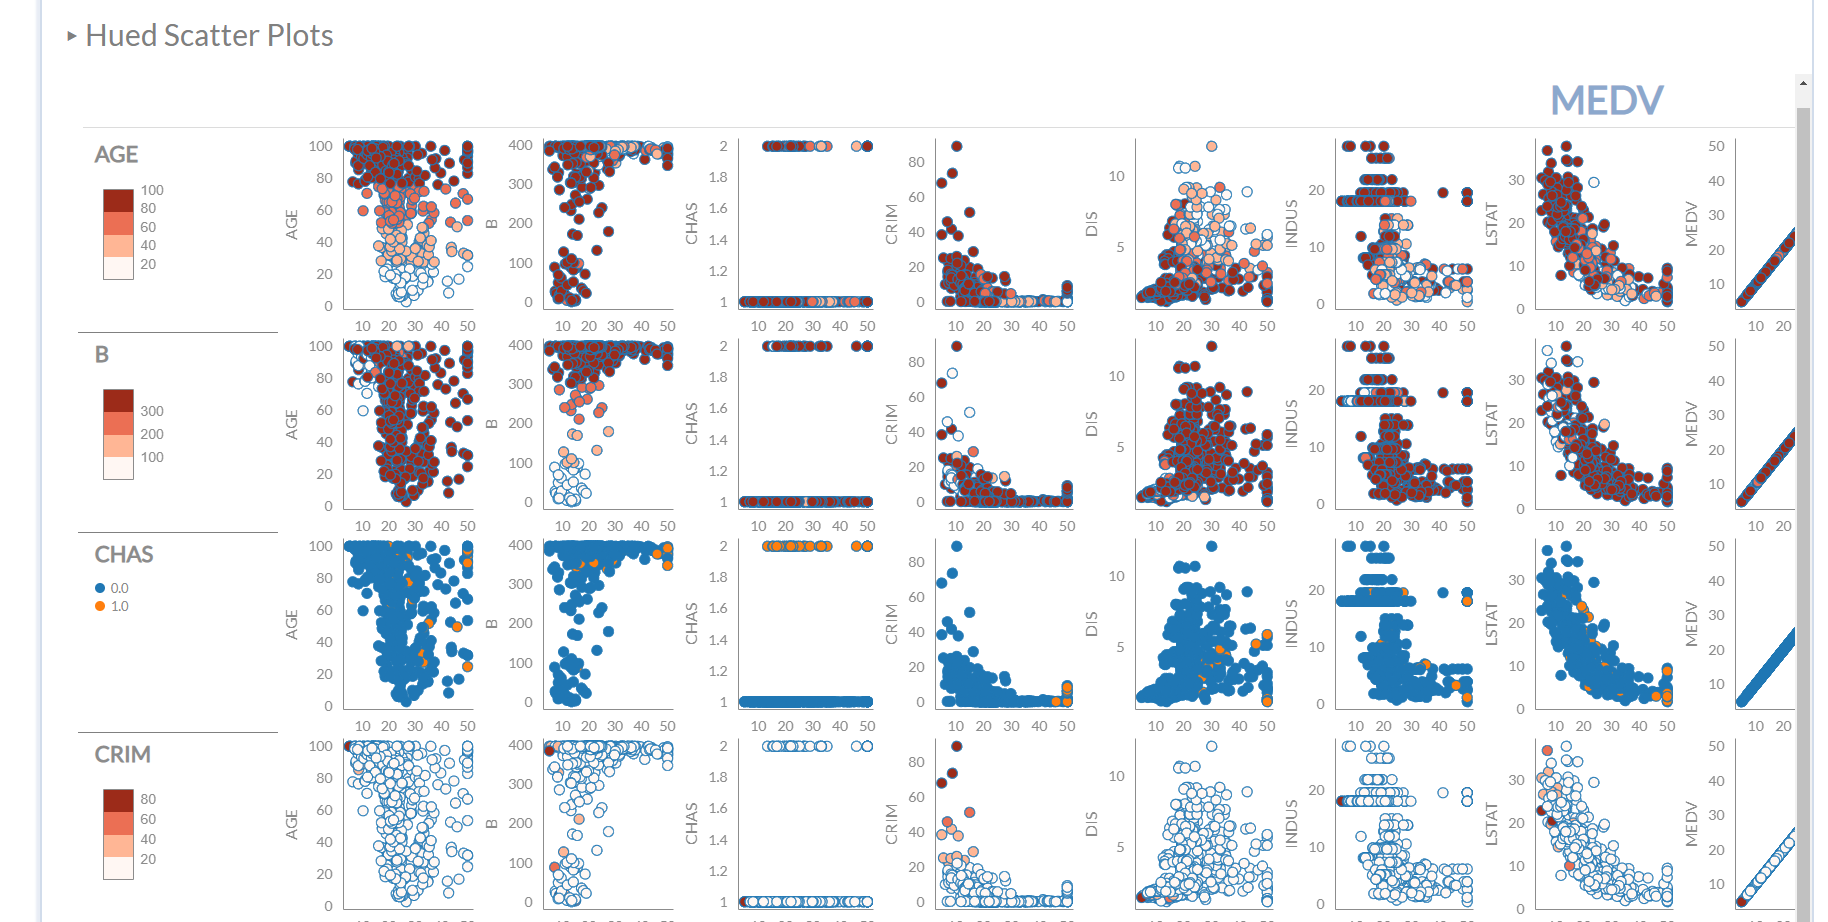
ScatterPlot Grid is included in the last section - Bokeh visualization that plots every feature against
another as scatter plots in a manner similar to seaborn pairplot, but with a twist added - every feature is also used
as a hue (coloring). The idea behind it was to provide visual assistance with manual feature engineering (if there are
any easily separable groups).
Note
Row with a chosen Feature on X axis and coloring by the same Feature is greyed out to minimize confusion (ideally separate colored groups would be present). Greying out was included as an alternative to removing that row, as it was technically difficult to not break the whole structure of the Grid while doing that.
Models
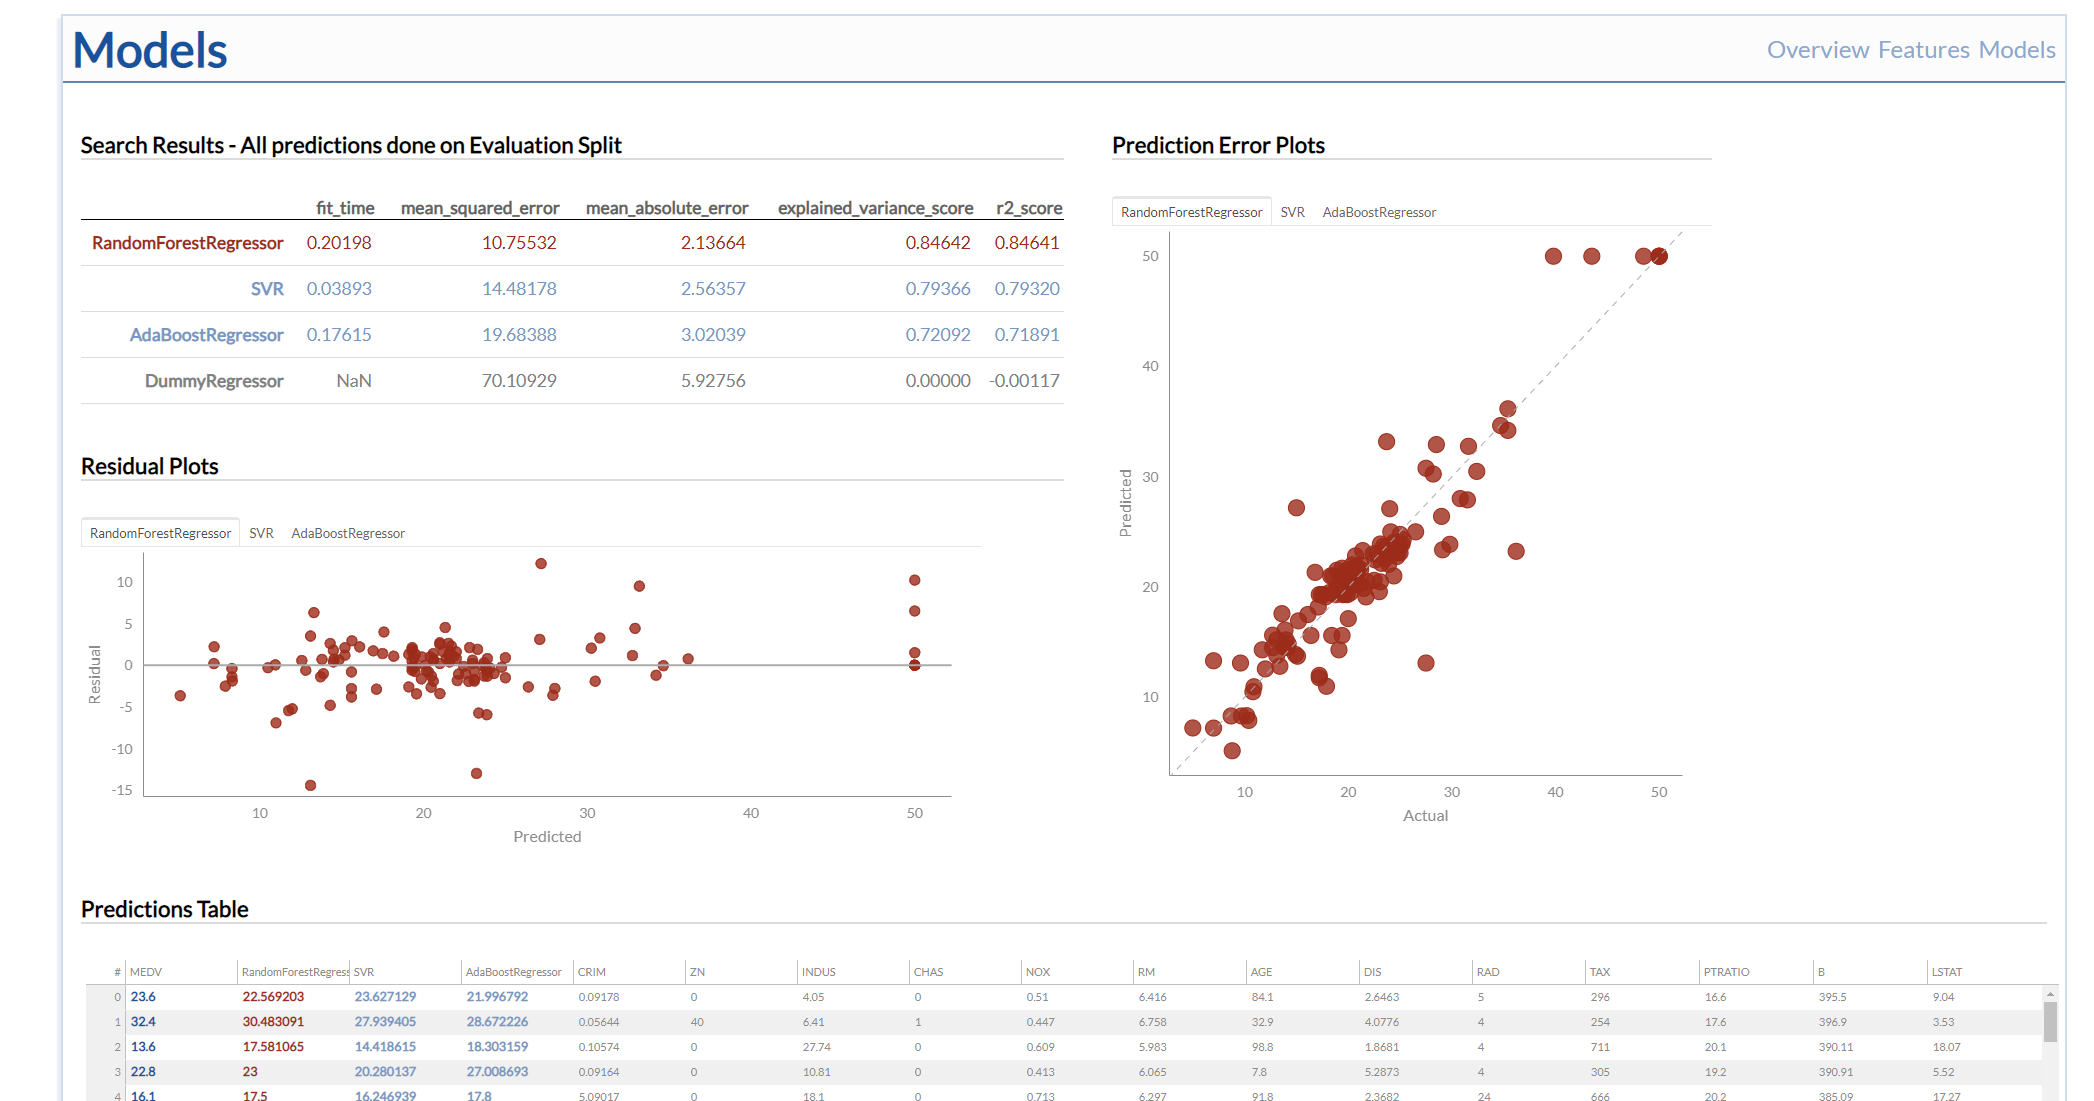
Models subpage gives information on provided Models performance. Shown results and visualizations will always
correspond to the 3 best scoring Models chosen during HTML Dashboard creation (search methods). Even though provided plots
will be different based on a problem type, scoring table in the upper left corner and
predictions table at the bottom stay the same.
Note
Model names are ‘hoverable’ in a similar manner to Feature Names in Overview subpage - the difference being
that instead of descriptions, used params are shown.
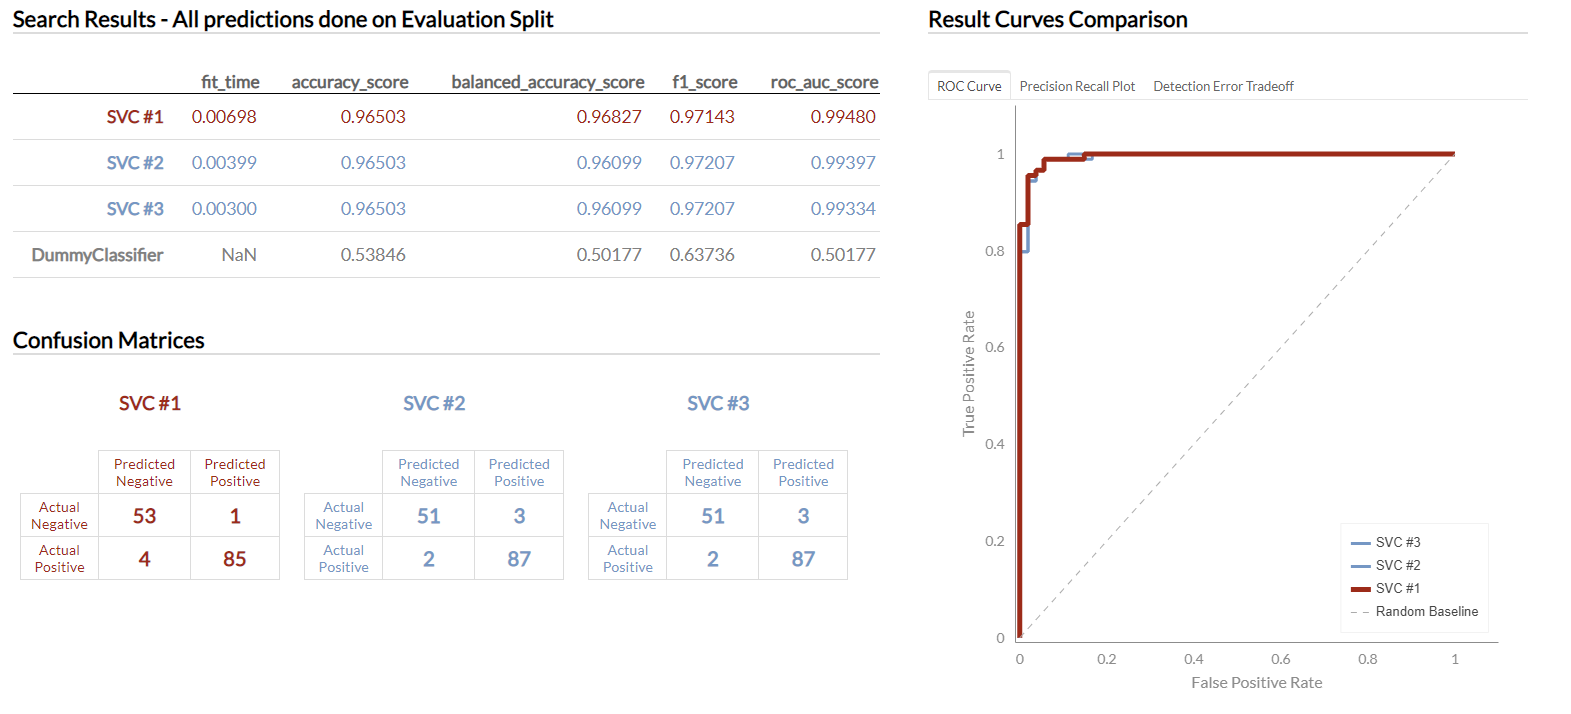
Classification
Models subpage in classification problem generates Plots of performance curves (ROC curve,
precision-recall curve and detection error tradeoff curve) and Confusion Matrices for every model (see sklearn
roc,
precision-recall,
detection error tradeoff).
Note
Legend is interactive - you can mute lines by clicking at a particular legend entry.
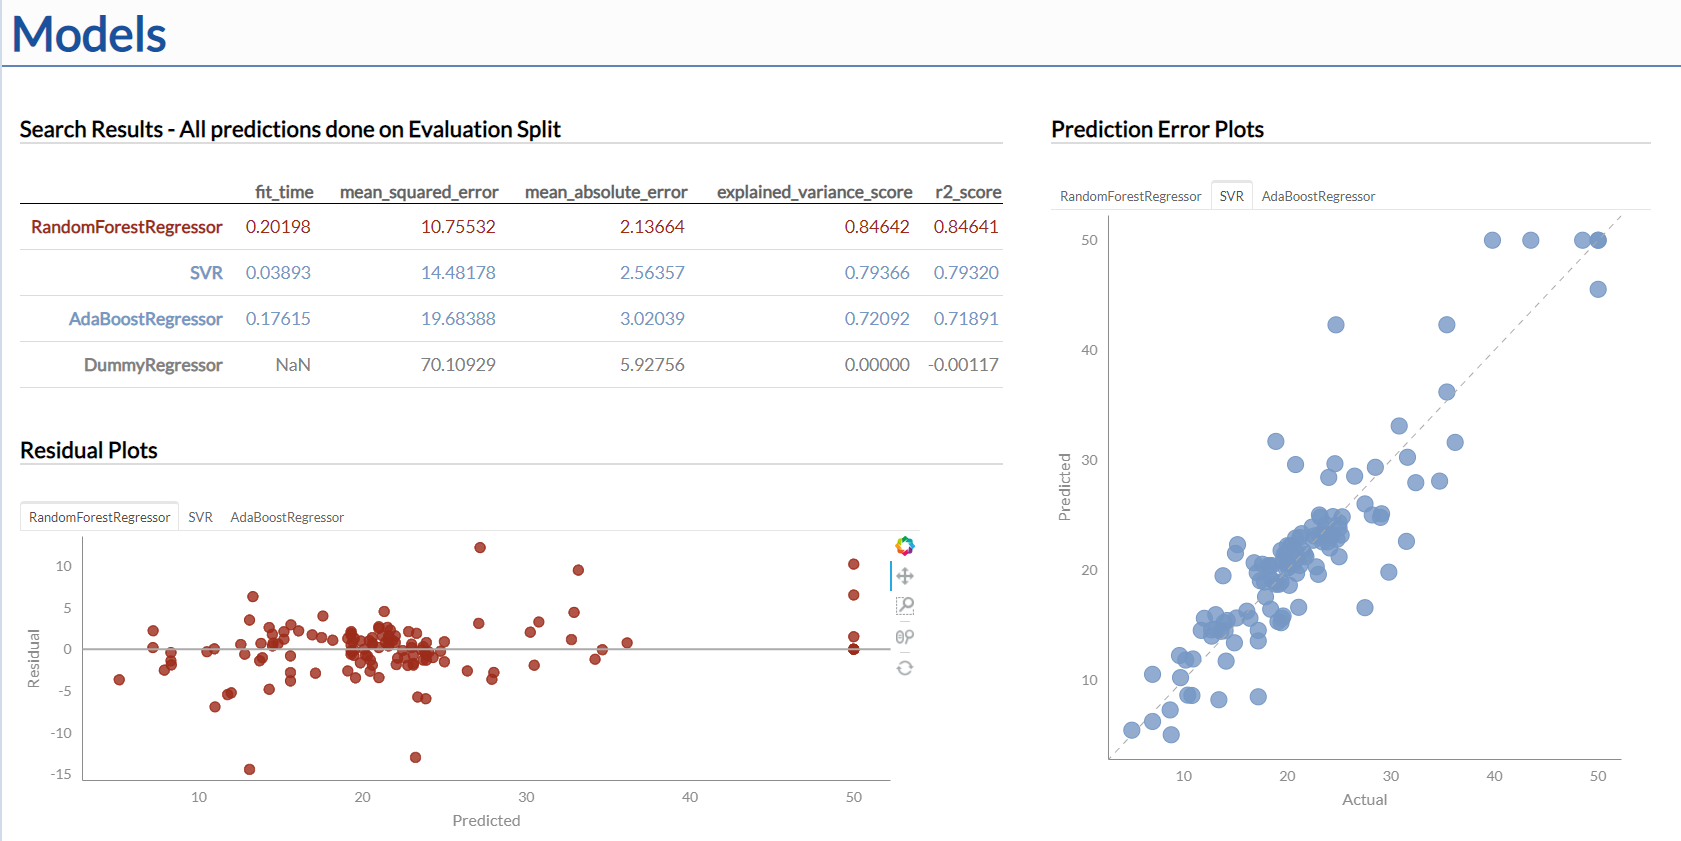
Regression
Models subpage in regression problem generates two Plots for every Model: prediction errors and residuals.
prediction errorsplot shows Actual Target on X axis and Predicted Target on Y Axis;residualsplot shows Actual Target on X axis and the difference between Predicted and Actual on Y Axis.
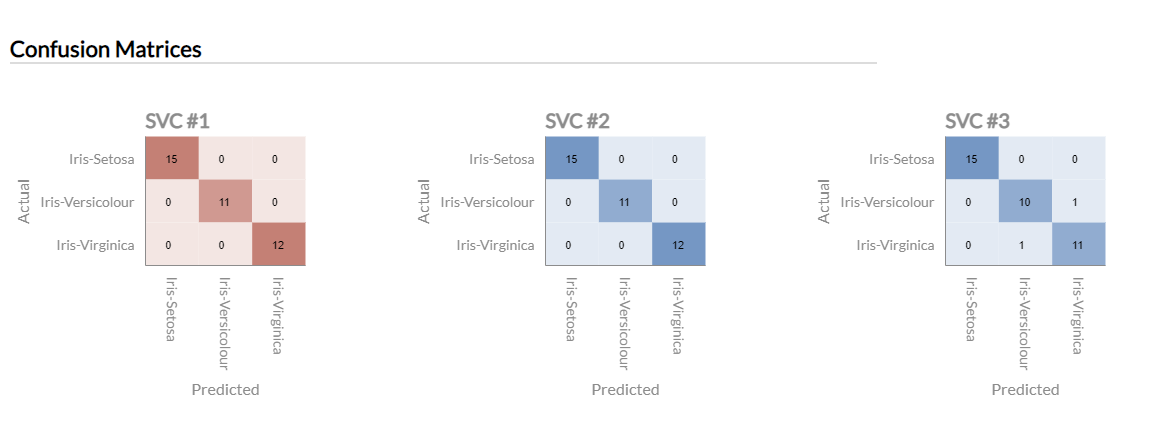
Multiclass
Models subpage in multiclass problem shows you Confusion Matrices for every Model assessed.